
Half year results for the six months ended 29 December 2018
Business overview
- Good progress made in all three strategic pillars: protect and grow the core; win new bus and rail contracts; prepare for the future of transport
- Group operating profit for the half year ahead of management expectations; full year expectations increased principally due to rail
- Bus operating profit pre-exceptional items slightly ahead of last year at £46.9m (2018: £46.6m)
- Rail operating profit at £17.6m (2018: £40.3m) ahead of expectations, though lower than last year due to the end of the London Midland franchise in December 2017
- GTR reliability significantly improved since last year’s timetable changes; contractual agreement reached with DfT in December 2018
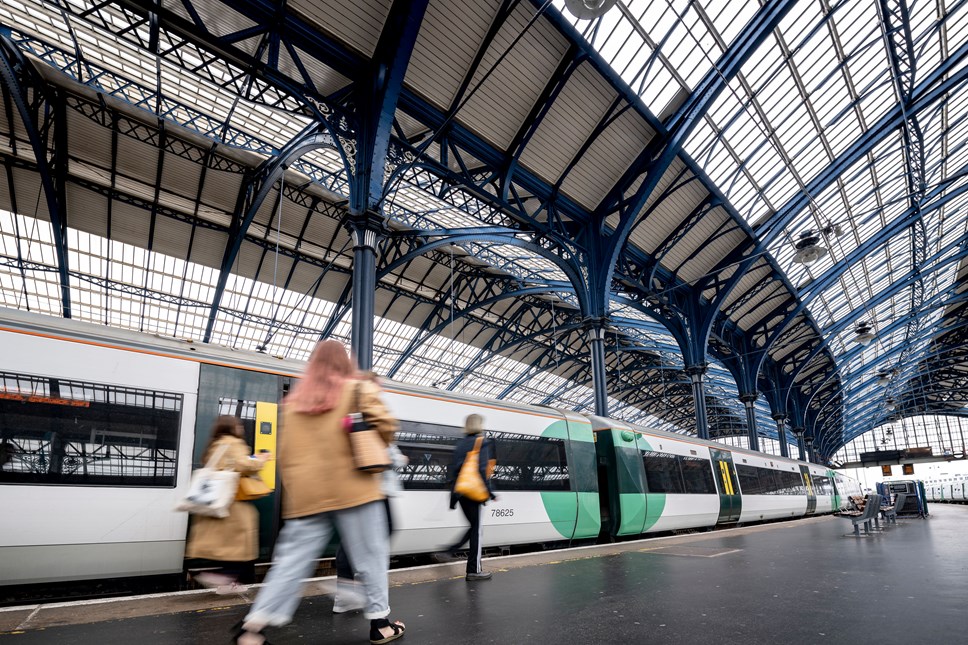
- Strong operational and financial performance continues at Southeastern; franchise extended by 12 weeks to 22 June 2019; shortlisted for the new South Eastern Franchise
- Continued progress in our international strategy: won our fifth rail contract in Germany, first rail contract in Norway and first consultancy contract in Australia
- Maintained interim dividend of 30.17p (2018: 30.17p) in line with policy
Financial summary
|
H1’19 |
H1’18 |
Increase/ |
|
|---|---|---|---|
|
Revenue (£m) |
1,920.8 |
1,829.4 |
5.0 |
|
Operating profit pre-exceptional item (£m) |
64.5 |
86.9 |
(25.8) |
|
Profit before tax pre-exceptional item (£m) |
61.0 |
79.7 |
(23.5) |
|
Profit before tax (£m) |
44.2 |
79.7 |
(44.5) |
|
Basic earnings per share pre-exceptional item (p) |
93.2 |
115.5 |
(19.3) |
|
Basic earnings per share after exceptional item (p) |
60.7 |
115.5 |
(47.4) |
|
Interim dividend per share (p) |
30.17 |
30.17 |
– |
Note: Exceptional item of (£16.8m) in H1’19 relates to GMP pension equalisation (H1’18: nil)
|
H1’19 |
H1’18 |
Increase/ |
|
|---|---|---|---|
|
Cashflow generated from operations (excluding restricted cash) (£m) |
112.0 |
167.1 |
(55.1) |
|
Free cashflow (£m) |
58.7 |
93.7 |
(35.0) |
|
Adjusted net debt (£m)* |
261.7 |
254.0 |
7.7 |
|
Adjusted net debt/EBITDA* |
1.34x |
1.03x |
* Adjusted net debt is net cash less restricted cash
David Brown, Group Chief Executive, commented:
“I’m pleased to report that our half year results are ahead of our expectations. Our bus operations showed resilience with profits slightly up on last year despite a challenging market environment. Whilst overall rail profits fell due to the end of the London Midland franchise in December 2017 and a lower result at GTR, they were ahead of expectations. Southeastern delivered good financial performance, up on last year.
“Our regional bus business grew passenger journeys by 2.3% on a like for like basis and we continue to make our services better and easier to use. We have invested a further £26.3m in this business during the half year, including 82 new low or zero emission buses.
In London, we have continued to make improvements to our service performance leading to an increase in our Quality Incentive
Contract income.
“In UK rail, both of our franchises have delivered better punctuality; Southeastern improving by 6 percentage points to 89% with its best Autumn performance on record, and GTR by 5 percentage points to 81%. The addition of 200 more daily GTR services from December 2018 has gone well and is providing increased travel choices for our customers. Southeastern has consistently been the best performing large train franchise in the UK in recent months and we have submitted a strong bid for the new South Eastern Franchise designed to deliver value to passengers, taxpayers and shareholders.
“Positive momentum in our international expansion continues with three further contract successes – a first rail contract in Norway, our fifth rail contract in Germany and a consultancy contract in Australia. Annualised revenue from the ten international contracts secured to date is expected to be over £400m when fully mobilised, and there is a good pipeline of further opportunities in our target markets.
We remain on track to deliver 15% to 20% of Group operating profit from international operations by 2022.
“Staying ahead of changing customer needs and expectations is a strategic priority. PickMeUp, our demand responsive transport operation in Oxford, has grown to 20,000 registered users and is providing 3,000 weekly rides. Our Billion Journey Project incubator is creating opportunities with dynamic start up businesses with two pilots underway and more innovations in the pipeline.
“Our companies collaborate with partners to deliver services that enable economic growth and work for all sections of society. We use smart technology to deliver efficient services and help customers take more control of their journeys. Go-Ahead is proud to be a responsible business that invests in its people and contributes to the sustainability of our cities and communities”.
Outlook
“For the Group overall, our full year expectations have increased, principally due to rail. We expect free cash flow generation to be strong, resulting in a reduction in net debt, excluding restricted rail cash, at year end and supporting the payment of dividends that are in line with our policy.
“Go-Ahead is an increasingly geographically diversified business, built on the safe and efficient provision of essential services. We remain committed to delivering long term value for all our stakeholders and our vision of a world where every journey is taken care of.”
ENDS
|
For further information, please contact: The Go-Ahead Group |
|
|
David Brown, Group Chief Executive |
020 7799 8971 |
|
Elodie Brian, Interim Group Chief Financial Officer |
020 7799 8973 |
|
Holly Gillis, Head of Investor Relations |
020 7799 8984 |
|
Citigate Dewe Rogerson |
020 7638 9571 |
|
Michael Berkeley/Angharad Couch/Toby Moore |
David Brown, Group Chief Executive, and Elodie Brian, Interim Group Chief Financial Officer, will be hosting a presentation for investors and analysts at 9.00am today at Investec, 30 Gresham Street, London EC2V 7QP.
A live audio webcast of the presentation will be available on Go-Ahead’s website; www.go-ahead.com. The presentation slides will be added to Go-Ahead’s website www.go-ahead.com at around 7:30am today.
I am pleased to report half year results that are ahead of our expectations with an improved outlook for the full year. Our bus business overall has delivered a pre-exceptional operating profit that is slightly ahead of last year despite the expected mileage reductions in London and the continuing market challenges in our regional businesses. Rail operating profit was ahead of expectations, though lower than last year as anticipated due to the end of the London Midland franchise in December 2017 and a lower result from GTR.
We have made further progress with all three of our strategic objectives and believe that we remain well positioned for the future. Reflecting the continued confidence in the Group’s prospects, the Board has maintained the interim dividend at 30.17p per share.
Customers
A core part of our strategy is to make travel on our services better and easier for our customers. We have continued to invest in our businesses with capital spend of £42.0m during the period. This includes £31.1m of investment in our bus operations including 93 new buses and the rollout of contactless payment options which has increased further and is now available for our customers on almost 95% of our regional bus fleet. In rail, there was capital investment of £10.9m with improvements to stations and facilities. Southeastern delivered its most punctual Autumn on record and has consistently been the best performing large train franchise in the UK in recent months.
We were also pleased to receive a 12-week extension to the current franchise, and we await the outcome on the award of the new South Eastern Franchise for which we are one of three shortlisted bidders. Operational reliability at GTR has also shown a marked improvement in recent months and over 200 additional services have also been added in December to provide extra capacity for our customers.
Communities
As one of the UK’s largest public transport operators, we play a vital role in underpinning social and economic activity in the communities where we operate. By providing essential bus and rail services we help people connect with each other and get to where they want to go. Public transport is key to the health and well-being of people: it reduces traffic congestion, is less harmful in terms of carbon emissions, and promotes increased levels of health and fitness by walking to and from bus stops and rail stations.
We are playing our part in promoting health and wellbeing with initiatives such as the research published in conjunction with RunFriendly and the University of Leeds examining the health benefits of active travel combined with public transport. We launched our Chatty Bus campaign across our UK bus companies which encourages people to start conversations. These are consistent with the UK government’s recently launched loneliness strategy which includes some associated funding.
Environment
We are proud to be a responsible business, and we take our environmental impact in terms of carbon emissions very seriously. We are targeting a further decline in emissions per vehicle mile on top of the reduction of over 30% achieved over the past three years. We will be introducing a further 30 new electric buses in 2020 with our Brighton & Hove and Go North East operations receiving funding from the UK Office for Low Emission Vehicles for a new wave of ultra-low emission buses securing our position as the largest operator of electric buses in the UK. We unveiled the UK’s first air filtering bus that makes the air around it cleaner as it travels using a specially designed filter that removes ultrafine particles from the air. Last month Go-Ahead became the first transport group to secure the ISO 50001 certification for all its bus and UK rail operations in recognition of its best practice in energy management. This demonstrates our commitment to energy efficiency and continual improvement, and we are targeting a further 20% reduction in carbon emissions by 2021.
People
Our people are the cornerstone of our business, and I would like to thank our 28,000 colleagues across the Group for their hard work and dedication. I am pleased with how our progressive strategy has permeated throughout our operating companies and how our three strategic pillars form the framework for discussion and decisions in all aspects of our business. I am also encouraged that our latest annual engagement survey results, which, for the first time included Singapore, showed an improvement in overall colleague engagement. I am also proud of our work to implement progressive apprenticeship programmes across our bus and rail divisions. Go-Ahead is the only business to have become an employer provider of apprenticeships for both bus and train driver roles in the transport sector. We view apprenticeships as the foundation stone of our talent programme and have the ambition to improve quality, invest in skills and develop
our workforce.
Protect and grow the core
Regional bus
The first half of the year has seen a return to growth in like for like passenger volumes which increased by 2.3%. This was helped by the better weather over the summer period. Like for like revenue grew by 3.8% reflecting our locally sensitive yield management strategies implemented by our devolved local management teams that are best placed to respond to their specific market dynamics. Reported growth in revenue and passenger journeys was 12.8% and 10.4% respectively following the acquisitions of East Yorkshire Motor Services
in June 2018 and Tom Tappin in December 2017.
Within our portfolio of regional bus companies, our local teams have employed specific initiatives to address their local markets. The lower level of operating profit in regional bus during the first half compared to last year reflects passenger yields rising by less than the aggregate of general cost inflation, additional depreciation and engineering costs resulting from our continued investment, and higher insurance costs. We have plans in place to deliver future cost improvements, including the rollout of a LEAN programme at our bus depots across the country and the introduction of technology where relevant to support efficient processes.
London bus
Considering the expected reductions in mileage, our London bus division has delivered a good result that is ahead of last year.
Our continued operational focus together with working effectively with Transport for London (TfL) has resulted in increased Quality Incentive Contract income (QICs) of £7.2m, up by £2.6m from last year.
We continue to work constructively in partnership with TfL to address the implications of their reduced funding as well as on other key issues such as safety and air quality.
Having navigated through a period of above normal contract expiries over the past two years, we are pleased that our expected revenue in London for the current year has been secured. We also have an opportunity to bid for new work in upcoming contract tenders during a period when retenders of our existing work are at relatively lower levels. Bids for new work continue to be made with financial discipline and our current success rate is encouraging.
Reported within the London bus division, our bus operations in Singapore continue to perform well, both operationally and financially. We also successfully began bus operations in Dublin during the period which have made a small positive contribution to the reported result.
Rail
Southeastern has continued to achieve good results, and we remain focused on driving even more operational and customer service improvements as the current franchise nears its expiry. The option exercised by the Department for Transport (DfT) for a 12-week extension to the franchise term takes it through to 22 June 2019. We have submitted a strong bid for the new South Eastern franchise that is designed to deliver value to passengers, taxpayers and shareholders alike and we await the outcome of the award from the DfT.
GTR service performance has improved significantly since the implementation of the July interim timetable and I am pleased that the introduction of a further 200 services in December has gone well. During the reporting period, we also reached agreement with the DfT which settles the majority of past issues relating to GTR, significantly reducing the uncertainty over the future of the franchise and enabling a renewed emphasis on running an effective operation and delivering for our customers. It also provides additional funding to be used for the benefit of passengers which is incorporated in our margin guidance of 0.75% to 1.0% over the life of the franchise. We continue to work with the Office of Rail and Road (ORR) in its inquiry.
We welcome the wide reaching review launched by the DfT into the rail industry which is expected to consider ambitious recommendations for reform to deliver value for money for passengers and taxpayers. We are working with the review’s independent chair Keith Williams and his team to further our shared aim of ensuring that our vital rail system continues to benefit passengers and support a stronger economy.
Win new bus and rail contracts
Our experience of over three decades of providing public transportation in the UK has positioned us well to use our expertise to deliver services in overseas markets and I am pleased with our positive momentum on building our international activities which will become an increasingly important part of the Group in the future. Our clear international strategy, with a well-defined framework for targeting overseas activities, has been rewarded with ten contract awards to date. These are expected to generate annualised revenues of over £400m when they are all in operation.
During the period, we were awarded the Norway South package of rail services covering a mixture of long distance and suburban routes. This is the first rail contract to be let in Norway and there is a pipeline of other work in Norway and in other Nordic countries that fit our target criteria. We were also awarded our fifth rail contract in Germany which will extend our German business to approximately 20 million train kilometres per year. Our local teams continue to look for further opportunities in the region as part of our strategy to build a long-term German transport business. We also won our first contract in Australia, a consultancy partnership with Network Rail to bring our UK rail expertise to New South Wales as Systems Integrator for the Digital Systems Programme. This will replace existing signalling and train control systems with modern, internationally proven intelligent technology.
We remain on track to reach our objective of 15-20% of Group operating profit to be derived from activities outside of the UK by 2022.
Develop for the future of transport
We continue to develop for the future of transport with further innovations to ensure that we carry on providing our customers with attractive transport solutions as their travel patterns and preferences evolve.
PickMeUp, our demand responsive trial in Oxford which launched last June, recently helped our Oxford Bus Company and the Group win the award for Most Innovative Customer Serving Operator at the respected annual European Transport Ticketing Global Awards.
It now has 20,000 registered users and is providing 3,000 weekly rides. TfL has awarded us a demand responsive pilot in Sutton to go live in the Spring.
Other initiatives are also making progress. Our plans to pilot Mobility as a Service (MaaS) to provide customers access to easier multi-mode end-to-end journeys are progressing with an agreement on the solution design and branding and the formation of the project team. We have also started the development of the MaaS software for our Brighton & Hove regional bus business. Our Hammock proposition established to deliver consultancy, retail and digital solutions for public transport completed two contracts during the half year and has other opportunities in its pipeline.
Following the success of the first phase of our Billion Journey project, the UK’s largest privately funded multi-modal transport incubator programme to partner with innovative start up businesses, we are piloting Citi Logik – providing crowding information to Thameslink passengers, and Airportr – a service that collects and carries air travellers’ luggage from home all the way to their destination. Brighton
& Hove Bus will be trialling a frictionless ticketing solution with Urban Things and Southeastern is looking to roll out an innovative train cleaning solution with HPC.
Outlook
Our first half results have resulted in an uplift to our expectations for full year Group operating profit based on outperformance in rail.
Our bus businesses have demonstrated stability, even in an increasingly challenging macro-economic environment, and we anticipate that operating profits for bus will be close to last year’s, underpinning our ability to provide an attractive dividend to shareholders.
For our rail businesses, whilst there remains economic uncertainty in the UK which could impact results at Southeastern in the second half of the year, its strong performance in the first half has raised our full year expectation for rail operating profit.
Go-Ahead’s increasing geographic diversification is broadening the footprint on which we deliver essential public services, safely and efficiently. We continue to demonstrate the value of private sector companies in providing innovative customer focused public transport services. Our strategy and values position us to deliver our vision of a world where every journey is taken care of.
Financial overview
Group revenue has increased as a result of continued revenue growth in both the bus and rail divisions. Bus operating profit (pre-exceptional items) is slightly up year on year despite challenging trading conditions in regional bus and a competitive market in London. The exceptional item of £16.8m is the impact of the Guaranteed Minimum Pension (“GMP”) ruling during the period on the bus defined benefit bus pension schemes. Rail operating profit is lower than the prior year as a result of the end of London Midland and the impacts of the settlement agreement with the DfT including the corresponding passenger enhancement charge in GTR. Improved profitability in Southeastern provided a partial offset. The adjusted net debt (net cash less restricted cash in the rail division) to EBITDA ratio was 1.34x, below the target range of 1.5x to 2.5x.
Group overview
|
H1’19 |
H1’18 |
||
|---|---|---|---|
|
Regional bus operating profit |
23.0 |
24.5 |
|
|
London bus operating profit |
23.9 |
22.1 |
|
|
Total bus operating profit1 |
46.9 |
46.6 |
|
|
Rail operating profit |
17.6 |
40.3 |
|
|
Group operating profit (pre-exceptional items) |
64.5 |
86.9 |
|
|
Exceptional Items |
(16.8) |
– |
|
|
Group operating profit (post-exceptional items) |
47.7 |
86.9 |
|
|
Share of result of joint venture |
(0.3) |
(0.3) |
|
|
Net finance costs |
(3.2) |
(6.9) |
|
|
Profit before tax |
44.2 |
79.7 |
|
|
Total tax expense2 |
(9.4) |
(16.1) |
|
|
Profit for the period |
34.8 |
63.6 |
|
|
Non-controlling interests |
(8.7) |
(14.0) |
|
|
Profit attributable to shareholders |
26.1 |
49.6 |
|
|
Profit attributable to shareholders pre-exceptional items |
40.0 |
49.6 |
|
|
Weighted average number of shares (m) |
42.9 |
42.9 |
|
|
Proposed dividend per share (p) |
30.17 |
30.17 |
|
1. Here and throughout, bus operating profit is stated pre-exceptional items
2. Includes the taxation impact of the exceptional items in H1’19
BUS
Bus overview
|
H1’19 |
H1’18 |
|
|---|---|---|
|
Revenue |
||
|
Regional bus |
£216.6m |
£192.1m |
|
London bus |
£275.0m |
£272.1m |
|
Total bus |
£491.6m |
£464.2m |
|
Operating profit |
||
|
Regional bus |
£23.0m |
£24.5m |
|
London bus |
£23.9m |
£22.1m |
|
Total bus |
£46.9m |
£46.6m |
|
Operating profit margin |
||
|
Regional bus |
10.6% |
12.8% |
|
London bus |
8.7% |
8.1% |
|
Total bus |
9.5% |
10.0% |
|
Revenue growth |
||
|
Regional bus1 |
3.8% |
0.4% |
|
London bus2 |
(0.1%) |
1.5% |
|
Volume growth |
||
|
Regional bus – passenger journeys1 |
2.3% |
(1.2%) |
|
London bus – miles operated2 |
(2.5%) |
(0.5%) |
|
London bus – peak vehicle requirement (PVR)3 |
(6.6%) |
(0.9%) |
|
Customer satisfaction4 |
||
|
Regional bus |
91% |
90% |
1 On a like for like basis, excluding acquisitions (H1’19) and acquisitions and route restructuring (H1’18)
2 On a like for like basis, excluding the impact of Ireland bus operations in its first year of operation
3 PVR is the number of vehicles required to operate the highest service frequency on a route. This measure provides a useful indication of the volume of contract work being operated from one year to the next
4 Based on the Transport Focus annual independent passenger survey – Spring 2018, published in March 2018
Overall bus performance
Overall bus operations delivered stable year on year half year operating profit. Increased revenue in regional bus and strong performance in our London and Singapore businesses have offset increased costs including those relating to our investment in upgrading our fleet and some one-offs. Operating profit rose 0.6%, or £0.3m, to £46.9m (H1’18: £46.6m) and operating profit margin decreased by 0.5ppts to 9.5% (H1’18: 10.0%).
Regional bus
Like for like revenue growth of 3.8% and an increase in passenger numbers of 2.3% reflect a good performance in challenging market conditions prevailing across the industry. Reported growth in revenue and passenger journeys was 12.8% and 10.4%, respectively with the main difference reflecting the acquisition of East Yorkshire in June 2018. Route wins have resulted in like for like mileage growth of 2.7% with an improvement in revenue per mile of 1.0% but a decrease in journeys per mile of 0.4%.
Regional bus operating profit was £23.0m (H1’18: £24.5m), down 6.1%, or £1.5m, compared with the corresponding period last year. This reflects passenger yields rising by less than the aggregate of general cost inflation, additional depreciation and engineering costs resulting from our continued investment, and higher insurance costs. Operating profit margin decreased 2.2ppts to 10.6% (H1’18: 12.8%).
Full year performance is expected to be close to last year.
|
£m |
|
|---|---|
|
H1’18 operating profit |
24.5 |
|
Change: |
|
|
Net impact of acquisitions and new ventures |
0.9 |
|
Passenger volumes (margin impact) |
0.5 |
|
Net cost inflation exceeding passenger yield |
(1.3) |
|
Depreciation |
(0.6) |
|
One-offs |
(1.0) |
|
H1’19 operating profit |
23.0 |
London bus
London bus revenue was broadly flat (0.1% down) on a like for like basis, excluding operations in Ireland which commenced trading on 9 September 2018. Like for like mileage fell by 2.5% whilst peak vehicle requirement fell by 6.6%, reflecting the timing of contract losses. The impact of these losses on revenue and the increase in cost base were more than offset by Quality Incentive Contract (QIC) income of £7.2m, in London alone, (H1’18: £4.6m) in the first half.
Operating profit for the London bus division was £23.9m (H1’18: £22.1m), up 8.1%, or £1.8m. The operating profit margin increased to 8.7% (H1’18: 8.1%) reflecting higher margins in Singapore and improved QICs performance. Full year performance is expected to be similar to last year.
|
£m |
|
|---|---|
|
H1’18 operating profit |
22.1 |
|
Change: |
|
|
QIC bonuses |
2.6 |
|
Volume reductions |
(0.7) |
|
Depreciation |
(1.0) |
|
One-offs |
(0.6) |
|
Singapore and Dublin operations |
1.5 |
|
H1’19 operating profit |
23.9 |
Capital expenditure
Capital expenditure for the bus division was £31.1m (H1’18: £39.3m), including £17.6m on 93 new buses (H1’18: £30.8m on 139 new buses).
Fuel hedging
The fuel spot price on 31 December 2018 was 35.0 pence per litre (ppl) (30 June 2018: 35.5 ppl). The decrease in the spot price resulted in a movement in the value of the fuel derivative during the period from an asset of £18.1m at 30 June 2018 to a liability of £0.1m at 29 December 2018. The movement in the value of the fuel derivative does not impact the income statement, as it is taken through the statement of other comprehensive income.
Fuel is hedged in sterling and therefore the hedges are not subject to foreign exchange risk.
RAIL
Rail overview
|
H1’19 |
H1’18 |
|
|---|---|---|
|
Total revenue |
£1,429.2m |
£1,365.2m |
|
Operating profit |
£17.6m |
£40.3m |
|
Operating profit margin |
1.2% |
3.0% |
|
Passenger revenue growth1 |
||
|
Southeastern |
7.4% |
2.3% |
|
Passenger journey growth1 |
||
|
Southeastern |
5.5% |
(0.7%) |
|
Punctuality2 |
||
|
Southeastern |
89% |
83% |
|
GTR |
81% |
76% |
|
Customer satisfaction3 |
||
|
Southeastern |
78% |
80% |
|
GTR |
75% |
76% |
1 On a like for like basis adjusted for one off factors
2 DfT Public Performance Measure on a moving annual average basis
3 Based on the Transport Focus National Rail Passenger Survey – Autumn 2018
Rail performance
The rail division operates the Southeastern and GTR franchises in the UK, through a 65% owned subsidiary, Govia. Mobilisation is ongoing in Germany and Norway are ongoing and operations are due to commence in June 2019 and December 2019 respectively.
Revenue
Total rail revenue increased by 4.7%, or £64.0m, to £1,429.2m with the loss of the London Midland franchise income (£230.3m in H1’18) being offset by the increase in the number of trains operated by GTR. Revenue consisted of:
|
H1’19 |
H1’18 |
Increase/ |
Increase/ |
|
|---|---|---|---|---|
|
Passenger revenue |
1,275.7 |
1,151.8 |
123.9 |
10.8 |
|
Other revenue |
104.8 |
144.9 |
(40.1) |
(27.7) |
|
Subsidy and revenue support |
48.7 |
68.5 |
(19.8) |
(28.9) |
|
Total revenue |
1,429.2 |
1,365.2 |
64.0 |
4.7 |
Operating profit
Half year operating profit from our rail businesses was £17.6m (H1’18: £40.3m) reflecting the loss of the London Midland franchise in December 2017 and the impact of the GTR settlement with the DfT and resulting passenger enhancement charge. This is offset by an improvement in Southeastern, following continuing strong passenger growth and operational performance. The division’s operating profit margin decreased by 1.8ppts to 1.2% (H1’18: 3.0%).
|
H1’18 operating profit |
£m |
|---|---|
|
Change: |
40.3 |
|
Southeastern |
10.1 |
|
London Midland |
(20.8) |
|
GTR |
(13.3) |
|
Bid, mobilisation and other costs |
1.3 |
|
H1’19 operating profit |
17.6 |
Capital expenditure
Capital expenditure in rail was £10.9m (H1’18: £17.5m), of which £2.4m related to Southeastern, £3.3m reflected investment in GTR, including the introduction of new ticket machines, and £5.2m was in relation to set up costs in Germany.
Bid costs
Rail bid costs in the half year were £4.4m (H1’18: £6.9m), primarily relating to international bids. We expect full year bid costs of around £8.5m, with ongoing bidding activity in target markets.
Individual franchise performance
Southeastern
Southeastern has continued to perform very well and it has consistently been the best performing large train franchise in the UK in recent months. In the first half of the year, the rate of revenue and passenger growth for Southeastern has continued the improvement seen in the second half of last year. Growth has been supported by the resumption of full services through London Bridge station and by good weather during the period.
Passenger revenue growth was 7.4% while journeys grew by 5.5% on a like for like basis. On the 21 December 2018, the Department for Transport (DfT) confirmed a 12-week extension to the current Direct Award contract, from 1 April 2019 to 22 June 2019. Govia is shortlisted for the next South Eastern Franchise to be awarded by the DfT.
GTR
Agreement was reached with the Department for Transport ("DfT") regarding contractual matters in relation to the GTR franchise.
This agreement resolved the majority of matters relating to the industry-wide failures concerning the introduction of the May timetable, as well as bringing to a close discussions around other outstanding contractual variations.
As part of the agreement, a plan for the remainder of the franchise term to 2021 has been agreed, aimed at building on recent performance improvement and delivering better customer journeys. As part of this agreement GTR has provided £15m of funding this year for passenger enhancements and separately accounted for the impact of any potential fines with the Office of Rail and Road (“ORR”). The agreement reduces uncertainty around the future of the GTR franchise and its financial performance.
A profit-sharing mechanism with the DfT will also be introduced for the remainder of the franchise. As a result, the margin over the franchise term is now expected to be between 0.75 and 1 per cent (previously 0.75 to 1.5 per cent), with no profit expected in the current financial year.
FINANCIAL REVIEW
Earnings per share
Profit attributable to members was £26.1m in the period (H1’18: £49.6m) resulting in basic earnings per share of 60.7p (H1’18: 115.5p).
The decrease in basic earnings per share is due to the decrease in operating profit and an exceptional item relating to the Guaranteed Minimum Pensions (“GMP”) equalisation charge on the bus pension schemes. Excluding exceptional items, profit attributable to members was £40.0m in the period (H1’18: £49.6m) resulting in basic earnings per share of 93.2p (H1’18: 115.5p).
The weighted average number of shares was 43.0 million (H1’18: 42.9 million). The closing number of shares in issue, net of treasury shares, was 43.1 million (H1’18: 42.9 million).
Dividend
The Board proposes an interim dividend of 30.17p (H1’18: 30.17p). This is payable on 12 April 2019 to shareholders registered at the close of business on 29 March 2019.
Dividends paid in the period represent the payment of last year’s final dividend of 71.91p (H1’18: 71.91p), giving a total dividend in respect of the full year ended 30 June 2018 of 102.08p (1 July 2017: 102.08p).
Summary cashflow
|
H1’19 |
H1’18 |
Increase/ |
|
|---|---|---|---|
|
EBITDA |
106.1 |
132.9 |
(26.8) |
|
Working capital/other items (excluding restricted cash movements) |
5.9 |
34.2 |
(28.3) |
|
Cashflow generated from operations |
112.0 |
167.1 |
(55.1) |
|
Tax paid |
(3.9) |
(12.6) |
8.7 |
|
Net interest paid |
(6.3) |
(13.9) |
7.6 |
|
Net capital investment |
(37.5) |
(46.0) |
8.5 |
|
Dividends paid – minority partner |
(5.6) |
(0.9) |
(4.7) |
|
Free cashflow |
58.7 |
93.7 |
(35.0) |
|
Net acquisitions |
– |
(3.9) |
3.9 |
|
Transferred with franchise |
– |
(23.5) |
23.5 |
|
Proceeds from issue of shares |
– |
0.6 |
(0.6) |
|
Payment to acquire treasury shares |
(0.6) |
(0.6) |
– |
|
Dividends paid |
(30.9) |
(30.9) |
– |
|
Other |
0.1 |
(3.6) |
3.7 |
|
Movement in adjusted net debt * |
27.3 |
31.8 |
(4.5) |
|
Opening adjusted net debt * |
(289.0) |
(285.8) |
n/a |
|
Closing adjusted net debt * |
(261.7) |
(254.0) |
n/a |
* Adjusted net debt is net cash less restricted cash
Cashflow
Cashflow generated from operations before taxation decreased by £55.1m to £112.0m (H1’18: £167.1m) reflecting decreased EBITDA and a positive movement in working capital and other items of £5.9m (H1’18: working capital movement of £34.2m). In the prior period, this includes the cessation of the London Midland franchise.
Tax paid of £3.9m (H1’18: £12.6m) related to the final instalments of the 2017/18 tax year. Net interest paid of £6.3m (H1’18: £13.9m) was higher than the net charge for the period of £3.2m (H1’18: £6.9m) due to amounts in respect of interest on the £250m sterling bond which is paid annually in July each year. Capital expenditure, net of sale proceeds in the period, was £37.5m (H1’18: £46.0m). Net capital expenditure for the full year is expected to be around £85m.
Capital expenditure
Expenditure on capital during the period can be summarised as:
|
H1’19 |
H1’18 |
Increase/ |
|
|---|---|---|---|
|
Regional Bus |
26.3 |
27.0 |
(0.7) |
|
London Bus |
4.8 |
12.3 |
(7.5) |
|
Total Bus |
31.1 |
39.3 |
(8.2) |
|
Rail |
10.9 |
17.5 |
(6.6) |
|
Total |
42.0 |
56.8 |
(14.8) |
Net cash / (debt)
Net cash was £199.9m at the half year end (30 June 2018: net cash £149.9m; H1’18: net cash £164.8m). This largely reflects the working capital movement in the rail division and reduced capital expenditure in the period. As the rail division working capital movement is included within restricted cash, adjusted net debt is primarily impacted by bus capital expenditure.
Adjusted net debt, consisting of net cash less restricted cash in our rail division of £461.6m (H1’18: £418.8m), was £261.7m (H1’18: £254.0m), equivalent to 1.34x EBITDA (30 June 2018: 1.30x; H1’18: 1.03x), below our target range of 1.5x to 2.5x.
Net cash comprised cash and short-term deposits of £595.5m (H1’18: £556.6m) less the £250m sterling bond, amounts drawn down against the £280.0m five-year revolving credit facility of £122.8m (H1’18: £134.0m), hire purchase and lease agreements of £7.6m
(H1’18: £2.6m) and amounts drawn down against the Euro financing facilities of £15.2m (H1’18: £5.2m).
Capital structure
|
H1’19 |
H1’18 |
FY’18 |
|
|---|---|---|---|
|
5 year revolving credit facility (RCF) 2023 |
280.0 |
280.0 |
280.0 |
|
7 year £250m 2.5% sterling bond 2024 |
250.0 |
250.0 |
250.0 |
|
Euro financing facility |
16.5 |
16.5 |
16.5 |
|
Total core facilities |
546.5 |
546.5 |
546.5 |
|
Amount drawn down at period end |
388.0 |
389.2 |
397.2 |
|
Balance available |
158.5 |
157.3 |
149.3 |
|
Restricted cash |
461.6 |
418.8 |
438.9 |
|
Net (cash)/debt |
(199.9) |
(164.8) |
(149.9) |
|
Adjusted net debt |
261.7 |
254.0 |
289.9 |
|
EBITDA |
106.1 |
132.9 |
221.9 |
|
Adjusted net debt/EBITDA (12month rolling basis) |
1.34x |
1.03x |
1.30x |
Significant medium-term finance is secured through our revolving credit facility (RCF) and £250m sterling bond. The RCF has a maturity of July 2023 with a further two one-year extensions which if exercised would extend the maturity to July 2025.
Net finance costs
Net finance costs for the period were £3.2m (H1’18: £6.9m), comprising finance costs of £5.0m (H1’18: £7.8m) less finance revenue of £1.8m (H1’18: £0.9m). The average net interest rate for the period was 3.2% (H1’18: 3.8%), lower than prior year due to the lower interest rate payable on the £250.0m sterling bond plus impact of timing of change over on the bond in the prior year.
Amortisation
The amortisation charge for the period was £2.4m (H1’18: £1.5m) which relates to the non-cash cost of amortising software costs, franchise bid costs and customer contracts. This is higher than the previous year due to increased investment in software.
Exceptional operating items
On 26 October 2018 the High Court ruled that guaranteed minimum pensions should be equalised between men and women. As a result, pension scheme trustees will be obliged to adjust benefit payments in order that benefits received by male and female members with equivalent age, service and earnings histories are equal. The judgement has implications for many defined benefit schemes, including those in which the Go-Ahead Group participates.
We have worked with our actuarial advisors to understand the implications of the judgement and the £16.8m pre-tax exceptional, non-cash expense in the period (H1’18: £nil) reflects our best estimate of the effect on our reported pension liabilities.
Taxation
Net tax for the period of £9.4m (H1’18: £16.1m) reflects an effective tax rate of 21.3% (H1’18: 20.2%). This is above the statutory rate for the period of 19.0% as a result of international bid costs and other disallowable expenditure. The effective tax rate for the full year is expected to be around 21.0%.
An agreement to settle the HMRC enquiry in relation to Capital Allowances occurred in the period. This settlement was in line with the provision made at the year end and was paid during January 2019.
Non-controlling interests
Non-controlling interests in the income statement of £8.7m (H1’18: £14.0m) are a result of our holding of 65% in Govia Limited which owns 100% of our current UK rail operations and therefore represents 35% of the profit after taxation of these operations.
Pensions
Operating profit includes the net cost of the Group’s defined benefit pension plans for the period of £18.0m (H1’18: £20.0m), comprising bus costs of £0.9m (H1’18: £0.8m) and rail costs of £17.1m (H1’18: £19.2m). Group contributions to the schemes totalled £20.7m
(H1’18: £22.7m).
The net deficit after taxation on the bus defined benefit schemes was £1.0m (30 June 2018: surplus of £30.3m), consisting of pre tax liabilities of £1.2m (30 June 2018: asset of £36.8m) less a deferred tax asset of £0.2m (30 June 2018: liability of £6.5m). The pre-tax deficit consisted of estimated assets of £816.5m (30 June 2018: £829.3m) less liabilities of £817.7m (30 June 2018: £792.5m). The percentage of assets held in higher risk, return seeking assets was 50.0% (30 June 2018: 48.5%).
An asset backed funding arrangement is in place which gives the bus pension scheme trustees a right to the income generated from some Group properties. This reduces the actuarial deficit in the scheme at triennial scheme valuations which are used to determine future contribution levels. For the purposes of IAS 19 (revised) this interest has nil value within scheme assets as the properties involved are included in property, plant and equipment in the Group financial statements.
As the long-term responsibility for the rail pension schemes rests with the DfT only the share of surplus or deficit expected to be realised over the life of each franchise is recognised. At the half year end the rail pension scheme deficit was £nil (30 June 2018: £nil).
Impact of new accounting standards not yet effective
The new accounting standard, IFRS 16 Leases, is effective for accounting periods beginning on or after 1 January 2019 and will be adopted by the Group from 30 June 2019. The new standard establishes principles for the recognition, measurement, presentation and disclosure of leases and eliminates the operating lease classification meaning lessees are required to recognise right of use assets and lease liabilities for all leases on the balance sheet. A project is underway to implement this standard for the year ended 28 June 2020. Until this project is finalised it is not possible to accurately determine the value of right of use assets and lease liabilities that will be recognised on adoption of the standard, however it is expected that IFRS 16 will have a material impact on the Group’s balance sheet.
At 29 December 2018, the Group held a significant number of operating leases that are expensed over the lease term. The total commitment at 30 June 2018 was £2,827.3m, which represents the gross value and is before the discounting of commitments to their present value required by IFRS 16.
Brexit
In light of the uncertainty around the terms of the UK’s departure from the EU, the Group has conducted a risk review process and has put practical mitigation measures in place against identifiable risks including increasing spare parts and supporting our EU-citizen colleagues that wish to remain in the UK. Southeastern are actively engaged with industry partners to mitigate any impact from congestion and logistical disruption that may arise in Kent.
Risk management
During the period, the Board reviewed the risks and uncertainties described in the Group’s Annual report and Accounts for the year ended 30 June 2018 and identified principal risks and uncertainties affecting the Group’s business for the second six months of the financial year ending 29 June 2019.
These key risks and uncertainties include external, strategic and operational factors as outlined in note 3 in the notes to the interim consolidated financial statements.
More details about these risks can be found on pages 44-49 of the ‘Managing Risk’ section of the Group Annual Report and Accounts for the year ended 30 June 2018, available on our website at www.go-ahead.com.
|
Six months to 29 Dec 18 |
Six months to |
Year to 30 Jun 18 |
||||||
|
Notes |
Pre- exceptional |
Exceptional |
Post- exceptional |
|
Pre- exceptional |
Exceptional |
Post- exceptional |
|
|
Group revenue |
4 |
1,920.8 |
– |
1,920.8 |
1,829.4 |
3,461.5 |
– |
3,461.5 |
|
Operating costs |
5 |
(1,856.3) |
(16.8) |
(1,873.1) |
(1,742.5) |
(3,325.6) |
25.1 |
(3,300.5) |
|
Group operating profit |
64.5 |
(16.8) |
47.7 |
86.9 |
135.9 |
25.1 |
161.0 |
|
|
Share of result of joint venture |
(0.3) |
– |
(0.3) |
(0.3) |
(1.1) |
– |
(1.1) |
|
|
Finance revenue |
1.8 |
– |
1.8 |
0.9 |
2.5 |
– |
2.5 |
|
|
Finance costs |
(5.0) |
– |
(5.0) |
(7.8) |
(14.1) |
(2.6) |
(16.7) |
|
|
Profit before taxation |
61.0 |
(16.8) |
44.2 |
79.7 |
123.2 |
22.5 |
145.7 |
|
|
Tax expense |
6 |
(12.3) |
2.9 |
(9.4) |
(16.1) |
(24.9) |
(11.5) |
(36.4) |
|
Profit for the period from continuing operations |
48.7 |
(13.9) |
34.8 |
63.6 |
98.3 |
11.0 |
109.3 |
|
|
Attributable to: |
||||||||
|
Equity holders of the parent |
40.0 |
(13.9) |
26.1 |
49.6 |
78.0 |
11.0 |
89.0 |
|
|
Non-controlling interests |
8.7 |
– |
8.7 |
14.0 |
20.3 |
– |
20.3 |
|
|
48.7 |
(13.9) |
34.8 |
63.6 |
98.3 |
11.0 |
109.3 |
||
|
Earnings per share |
||||||||
|
– basic |
7 |
93.2p |
(32.5p) |
60.7p |
115.5p |
181.6p |
25.6p |
207.2p |
|
– diluted |
7 |
93.0p |
(32.4p) |
60.6p |
115.3p |
181.2p |
25.5p |
206.7p |
|
Dividend paid (pence per share) |
10 |
71.91p |
71.91p |
102.08p |
||||
|
Dividend proposed (pence per share) |
10 |
30.17p |
30.17p |
71.91p |
||||
|
Notes |
Six months to |
Six months to |
Year to |
|
|
Profit for the period |
34.8 |
63.6 |
109.3 |
|
|
Other comprehensive (losses)/income |
||||
|
Items that will not be reclassified to profit or loss |
||||
|
Remeasurements on defined benefit retirement plans |
(24.8) |
20.0 |
18.9 |
|
|
Tax relating to items that will not be reclassified |
6 |
4.3 |
(3.4) |
(3.3) |
|
(20.5) |
16.6 |
15.6 |
||
|
Items that may subsequently be reclassified to profit or loss |
||||
|
Unrealised (losses)/gains on cashflow hedges |
(12.8) |
15.7 |
30.5 |
|
|
(Losses)/gains on cashflow hedges taken to income statement – operating costs |
(5.3) |
0.5 |
(2.3) |
|
|
Tax relating to items that may be reclassified |
6 |
3.3 |
(3.1) |
(5.2) |
|
Foreign exchange (loss)/gain |
– |
(0.4) |
0.8 |
|
|
(14.8) |
12.7 |
23.8 |
||
|
Other comprehensive (losses)/income for the period, net of tax |
(35.3) |
29.3 |
39.4 |
|
|
Total comprehensive (losses)/income for the period |
(0.5) |
92.9 |
148.7 |
|
|
Attributable to: |
||||
|
Equity holders of the parent |
(9.2) |
78.9 |
128.4 |
|
|
Non-controlling interests |
8.7 |
14.0 |
20.3 |
|
|
(0.5) |
92.9 |
148.7 |
|
Share |
Reserve |
Hedging |
Other |
Capital redemption reserve |
Retained earnings |
Total shareholders’ |
Non-controlling interests |
Total |
|
|
At 1 July 2017 |
73.6 |
(71.9) |
(8.2) |
1.6 |
0.7 |
206.3 |
202.1 |
25.1 |
227.2 |
|
Profit for the year |
– |
– |
– |
– |
– |
89.0 |
89.0 |
20.3 |
109.3 |
|
Net movement on hedges |
– |
– |
23.0 |
– |
– |
– |
23.0 |
– |
23.0 |
|
Remeasurements on defined benefit retirement plans (net of tax) |
– |
– |
– |
– |
– |
15.6 |
15.6 |
– |
15.6 |
|
Foreign exchange gain |
– |
– |
– |
– |
– |
0.8 |
0.8 |
– |
0.8 |
|
Total comprehensive income |
– |
– |
23.0 |
– |
– |
105.4 |
128.4 |
20.3 |
148.7 |
|
Exercise of share options |
– |
1.7 |
– |
– |
– |
(1.7) |
– |
– |
– |
|
Share based payment charge |
– |
– |
– |
– |
– |
1.7 |
1.7 |
– |
1.7 |
|
Acquisition of own shares |
– |
(1.1) |
– |
– |
– |
– |
(1.1) |
– |
(1.1) |
|
Share issue |
0.6 |
– |
– |
– |
– |
– |
0.6 |
– |
0.6 |
|
Dividends (note 10) |
– |
– |
– |
– |
– |
(43.8) |
(43.8) |
(13.9) |
(57.7) |
|
At 30 June 2018 |
74.2 |
(71.3) |
14.8 |
1.6 |
0.7 |
267.9 |
287.9 |
31.5 |
319.4 |
|
Profit for the period |
– |
– |
– |
– |
– |
26.1 |
26.1 |
8.7 |
34.8 |
|
Net movement on hedges |
– |
– |
(14.8) |
– |
– |
– |
(14.8) |
– |
(14.8) |
|
Remeasurements on defined benefit retirement plans (net of tax) |
– |
– |
– |
– |
– |
(20.5) |
(20.5) |
– |
(20.5) |
|
Foreign exchange gain |
– |
– |
– |
– |
– |
– |
– |
– |
– |
|
Total comprehensive (losses)/income |
– |
– |
(14.8) |
– |
– |
5.6 |
(9.2) |
8.7 |
(0.5) |
|
Exercise of share options |
– |
1.0 |
– |
– |
– |
(1.0) |
– |
– |
– |
|
Share based payment charge |
– |
– |
– |
– |
– |
0.2 |
0.2 |
– |
0.2 |
|
Acquisition of own shares |
– |
(0.6) |
– |
– |
– |
– |
(0.6) |
– |
(0.6) |
|
Share issue |
– |
– |
– |
– |
– |
– |
– |
– |
– |
|
Dividends (note 10) |
– |
– |
– |
– |
– |
(30.9) |
(30.9) |
(5.6) |
(36.5) |
|
At 29 December 2018 |
74.2 |
(70.9) |
– |
1.6 |
0.7 |
241.8 |
247.4 |
34.6 |
282.0 |
for the six months ended 30 December 2017
|
Share |
Reserve |
Hedging |
Other |
Capital redemption reserve |
Retained earnings |
Total |
Non-controlling interests |
Total |
|
|
At 1 July 2017 |
73.6 |
(71.9) |
(8.2) |
1.6 |
0.7 |
206.3 |
202.1 |
25.1 |
227.2 |
|
Profit for the period |
– |
– |
– |
– |
– |
49.6 |
49.6 |
14.0 |
63.6 |
|
Net movement on hedges (net of tax) (note 12) |
– |
– |
13.1 |
– |
– |
– |
13.1 |
– |
13.1 |
|
Remeasurements of defined benefit retirement plans (net of tax) |
– |
– |
– |
– |
– |
16.6 |
16.6 |
– |
16.6 |
|
Foreign exchange loss |
– |
– |
– |
– |
– |
(0.4) |
(0.4) |
– |
(0.4) |
|
Total comprehensive income |
– |
– |
13.1 |
– |
– |
65.8 |
78.9 |
14.0 |
92.9 |
|
Exercise of share options |
– |
1.7 |
– |
– |
– |
(1.7) |
– |
– |
– |
|
Share based payment charge and associated tax |
– |
– |
– |
– |
– |
0.9 |
0.9 |
– |
0.9 |
|
Acquisition of own shares |
– |
(0.6) |
– |
– |
– |
– |
(0.6) |
– |
(0.6) |
|
Share issue |
0.6 |
– |
– |
– |
– |
– |
0.6 |
– |
0.6 |
|
Dividends (note 10) |
– |
– |
– |
– |
– |
(30.9) |
(30.9) |
(0.9) |
(31.8) |
|
At 31 December 2017 |
74.2 |
(70.8) |
4.9 |
1.6 |
0.7 |
240.4 |
251.0 |
38.2 |
289.2 |
|
Notes |
29 Dec 18 |
30 Dec 17 |
30 Jun 18 |
|
|
Assets |
||||
|
Non-current assets |
||||
|
Property, plant and equipment |
627.6 |
582.4 |
628.7 |
|
|
Intangible assets |
101.0 |
94.6 |
91.5 |
|
|
Trade and other receivables |
– |
0.2 |
– |
|
|
Deferred tax assets |
0.6 |
0.6 |
0.1 |
|
|
Investments |
0.3 |
– |
0.3 |
|
|
Interests in joint ventures |
– |
0.5 |
– |
|
|
Other financial assets |
12 |
1.6 |
2.8 |
8.1 |
|
Retirement benefit asset |
8 |
– |
1.5 |
41.4 |
|
731.1 |
682.6 |
770.1 |
||
|
Current assets |
||||
|
Inventories |
14.8 |
14.6 |
15.2 |
|
|
Trade and other receivables |
317.0 |
365.4 |
342.9 |
|
|
Other financial assets |
12 |
1.0 |
3.8 |
10.0 |
|
Assets classified as held for sale |
11 |
0.6 |
2.1 |
13.1 |
|
Cash and cash equivalents |
595.5 |
556.6 |
556.5 |
|
|
928.9 |
942.5 |
937.7 |
||
|
Total assets |
1,660.0 |
1,625.1 |
1,707.8 |
|
|
Liabilities |
||||
|
Current liabilities |
||||
|
Trade and other payables |
(792.2) |
(782.7) |
(804.8) |
|
|
Other financial liabilities |
12 |
(1.3) |
(0.4) |
– |
|
Interest-bearing loans and borrowings |
(8.4) |
(5.1) |
(8.4) |
|
|
Current tax liabilities |
(25.2) |
(15.6) |
(20.5) |
|
|
Provisions |
13 |
(35.9) |
(33.3) |
(29.6) |
|
(863.0) |
(837.1) |
(863.3) |
||
|
Non-current liabilities |
||||
|
Trade and other payables |
(1.2) |
(1.2) |
(1.0) |
|
|
Other financial liabilities |
12 |
(1.4) |
(0.2) |
– |
|
Interest-bearing loans and borrowings |
(386.2) |
(382.8) |
(394.8) |
|
|
Retirement benefit obligations |
8 |
(1.2) |
– |
(4.6) |
|
Deferred tax liabilities |
(41.2) |
(48.9) |
(51.0) |
|
|
Provisions |
13 |
(83.8) |
(65.7) |
(73.7) |
|
(515.0) |
(498.8) |
(525.1) |
||
|
Total liabilities |
(1,378.0) |
(1,335.9) |
(1,388.4) |
|
|
Net assets |
282.0 |
289.2 |
319.4 |
|
|
Capital & reserves |
||||
|
Share capital |
74.2 |
74.2 |
74.2 |
|
|
Reserve for own shares |
(70.9) |
(70.8) |
(71.3) |
|
|
Hedging reserve |
– |
4.9 |
14.8 |
|
|
Share premium reserve |
1.6 |
1.6 |
1.6 |
|
|
Capital redemption reserve |
0.7 |
0.7 |
0.7 |
|
|
Retained earnings |
241.8 |
240.4 |
267.9 |
|
|
Total shareholders’ equity |
247.4 |
251.0 |
287.9 |
|
|
Non-controlling interests |
34.6 |
38.2 |
31.5 |
|
|
Total equity |
282.0 |
289.2 |
319.4 |
|
Notes |
Six months to |
Six months to |
Year to |
|
|
Profit after tax for the year |
34.8 |
63.6 |
109.3 |
|
|
Net finance costs |
3.2 |
6.9 |
14.2 |
|
|
Tax expense |
6 |
9.4 |
16.1 |
36.4 |
|
Depreciation of property, plant and equipment |
39.4 |
44.3 |
82.7 |
|
|
Amortisation of intangible assets |
2.4 |
1.5 |
3.3 |
|
|
Goodwill/asset impairment |
– |
– |
10.1 |
|
|
Share of result of joint venture |
0.3 |
0.3 |
1.1 |
|
|
Profit on sale of assets held for sale |
0.1 |
– |
(0.9) |
|
|
Profit on sale of property, plant and equipment |
– |
(6.5) |
(7.3) |
|
|
Share based payment charges |
0.2 |
0.9 |
2.2 |
|
|
Difference between pension contributions paid and amounts recognised |
(3.6) |
(2.3) |
(6.3) |
|
|
Pension scheme exceptional items |
16.8 |
– |
(35.2) |
|
|
Decrease in inventories |
0.5 |
1.9 |
1.5 |
|
|
Decrease/(increase) in trade and other receivables |
21.0 |
(33.3) |
(1.9) |
|
|
Decrease in trade and other payables |
(6.3) |
(21.3) |
(18.9) |
|
|
Movement in provisions |
16.4 |
(2.5) |
0.7 |
|
|
Cashflow generated from operations |
134.6 |
69.6 |
191.0 |
|
|
Taxation paid |
(3.9) |
(12.6) |
(28.7) |
|
|
Net cashflows from operating activities |
130.7 |
57.0 |
162.3 |
|
|
Interest received |
1.8 |
0.9 |
2.5 |
|
|
Proceeds from sale of property, plant and equipment |
3.9 |
13.5 |
15.4 |
|
|
Proceeds from sale of property, plant and equipment held for sale |
12.4 |
– |
1.7 |
|
|
Purchase of property, plant and equipment |
(42.0) |
(56.8) |
(126.7) |
|
|
Purchase of property, plant and equipment held for sale |
– |
– |
(11.4) |
|
|
Purchase of intangible assets |
(11.8) |
(2.7) |
(10.1) |
|
|
Purchase of businesses |
– |
(5.4) |
(9.2) |
|
|
Cash acquired with subsidiary |
– |
1.5 |
2.0 |
|
|
Transferred with franchise |
– |
(23.5) |
(23.5) |
|
|
Acquisition of investments |
– |
– |
(0.3) |
|
|
Net cashflows used in investing activities |
(35.7) |
(72.5) |
(159.6) |
|
|
Interest paid |
(8.1) |
(14.8) |
(15.8) |
|
|
Dividends paid to members of the parent |
10 |
(30.9) |
(30.9) |
(43.8) |
|
Dividends paid to non-controlling interests |
(5.6) |
(0.9) |
(13.9) |
|
|
Payment to acquire own shares |
(0.6) |
(0.6) |
(1.1) |
|
|
Foreign exchange gain/(loss) |
0.2 |
(0.4) |
0.8 |
|
|
Repayment of borrowings |
(13.2) |
(221.2) |
(222.5) |
|
|
Proceeds from borrowings |
4.0 |
250.5 |
260.2 |
|
|
Proceeds from issue of shares |
– |
0.6 |
0.6 |
|
|
Payment of finance lease and hire purchase liabilities |
(1.8) |
(0.4) |
(0.9) |
|
|
Net cashflows on financing activities |
(56.0) |
(18.1) |
(36.4) |
|
|
Net increase/(decrease) in cash and cash equivalents |
39.0 |
(33.6) |
(33.7) |
|
|
Cash and cash equivalents at start of period |
9 |
556.5 |
590.2 |
590.2 |
|
Cash and cash equivalents at end of period |
9 |
595.5 |
556.6 |
556.5 |
1. Corporate information
The Go-Ahead Group plc is a public limited company that is incorporated, domiciled and has its registered office in England and Wales. Its ordinary shares are publicly traded and it is not under the control of any single shareholder.
2. Basis of preparation
The condensed financial statements for the six months ended 29 December 2018 have been prepared in accordance with the Disclosure and Transparency Rules (DTR) of the Financial Conduct Authority and IAS 34, ‘Interim Financial Reporting’, as adopted by the European Union. The condensed financial statements have been prepared using the same accounting policies and methods of computation used to prepare the Group’s 2018 Annual Report and Accounts as described on pages 134 to 141 of that report which can be found on the Group’s website at www.go-ahead.com and the adoption of new standards and interpretations, noted below. The annual financial statements of the Group are prepared in accordance with IFRS as adopted by the European Union.
The financial statements for the six months ended 29 December 2018 and the comparative financial statements for the six months ended 30 December 2017 have not been audited, but have been reviewed by the auditor, Deloitte LLP. The comparative financial statements for the year ended 30 June 2018 have been extracted from the 2018 Annual Report and Accounts. The financial statements contained in this interim report do not constitute statutory accounts as defined in section 435 of the Companies Act 2006 and do not reflect all of the information contained in the Group’s 2018 Annual Report and Accounts. The statutory accounts for the year ended 30 June 2018, which were approved by the Board of Directors on 5 September 2018 and have been filed with the Registrar of Companies, received an unqualified audit report which did not draw attention to any matters by way of emphasis and did not contain a statement under section 498 (2) or (3) of the Companies Act 2006.
The preparation of the financial statements requires the use of estimates and assumptions. Although these estimates are based on management’s best knowledge, actual results ultimately may differ from these estimates. The key sources of estimation uncertainty are consistent with those disclosed in the Group’s 2018 Annual Report and Accounts, with the exception of the majority of uncertainty surrounding the GTR franchise. This uncertainty has now been removed following the agreement reached with the Department for Transport (DfT) in the period and any future judgements and estimations will arise during the normal course of business.
The Group’s operations do not suffer from significant seasonal demand fluctuations.
New standards
The following new standards or interpretations are mandatory for the first time for the financial year ending 29 June 2019:
- IFRS 9 Financial Instruments;
- IFRS 15 Revenue from Contracts with Customers;
- IFRS 4 (amendments) Applying IFRS 9 Financial Instruments with IFRS 4 Insurance Contracts;
- IAS 40 (amendments) Transfers of Investment Property; and
- IFRIC 22 Foreign Currency and Advance Consideration.
As required by IAS 34, the nature and effect of the new standards are disclosed below:
IFRS 9 Financial Instruments
IFRS 9 is split into three areas: classification and measurement, impairment and hedging. IFRS 9 states that impairment provisions should be based on expected credit losses rather than incurred credit losses and the impact of this change in accounting policy is not material to the Group. The Group has also applied the standard on its hedging instruments, which comprise fuel derivatives, again there is no impact and the hedging instruments continue to be effective qualify as continuing hedges under IFRS 9. There will be some increased disclosure requirements under IFRS 9 and these will be reflected in the financial statements for the year ended 29 June 2019. The Group has applied the new rules prospectively from 1 July 2018.
IFRS 15 Revenue from contracts with customer
IFRS 15 establishes the principles that an entity is required to apply regarding the nature, amount, timing and uncertainty of revenue and cash flows arising from a contract with a customer. The new model is based on a five step approach which identifies whether, how much and when revenue is recognised.
The standard has been applied prospectively from 1 July 2018, the adoption of the standard has not had a material impact on the Group’s revenue recognition for the period and no adjustments were required to opening retained earnings.
Adoption of the other standards and interpretations had no material impact on the Group’s financial position or reported performance.
New standards and interpretations not yet applied
The International Accounting Standards Board (‘IASB’) has issued the following standards and interpretations with an effective date after the date of these financial statements:
|
International Accounting Standards (IAS/IFRSs) |
Effective date |
|
IFRS 16 Leases |
1 January 2019 |
|
IFRIC 23 Uncertainty over Income Tax Treatments |
1 January 2019 |
IFRS 16 Leases
IFRS 16 establishes principles for the recognition, measurement, presentation and disclosure of leases. The new standard eliminates the operating lease classification and therefore lessees will be required to recognise right of use assets and lease liabilities for all leases on the balance sheet, unless they have a lease term of less than twelve months or are of low value. On the income statement, the operating lease expense will be replaced by a combination of depreciation and interest.
A project is underway to implement this standard for the year ended 28 June 2020. Until this project is finalised it is not possible to accurately determine the value of right of use assets and lease liabilities that will be recognised on adoption of the standard, however it is expected that IFRS 16 will have a material impact on the Group’s balance sheet. At 29 December 2018, the Group held a significant number of operating leases that are expensed over the lease term. The total commitment at 30 June 2018 was £2,827.3m, which represents the gross value and is before the discounting of commitments to their present value required by IFRS 16.
The directors do not anticipate adoption of the remaining standards and interpretations will have a material impact on the Group’s
financial statements.
Going concern
Our medium term funding is provided through a £250m sterling bond due July 2024 and a £280m syndicated loan facility with an
anticipated repayment date of July 2023. The syndicated loan facility was £122.8m drawn down at the period end. The Board have also reviewed the risks and uncertainties facing the business, as outlined in note 3. After making enquiries and reviewing the outlook for 2019 and medium term plans of the business to 2021/2022, the directors have a reasonable expectation that the Group has adequate resources to continue in operational existence for the foreseeable future. Accordingly, they continue to adopt the going concern basis in preparing this half yearly report.
3. Risks and uncertainties
The Board has undertaken a review of the principal risks and uncertainties affecting the Group for the six months ended 29 December 2018. The Board consider that the principal risks and uncertainties (as discussed in the ‘Managing Risk’ section on pages 44 to 49 of the Group Annual Report and Accounts for the year ended 30 June 2018, available on the Group’s website www.go-ahead.com), remain relevant, with only minor changes made to the explanatory narrative. The Board also considered and approved an additional principal risk, Mobilisation of international rail contracts, details of which are set out below.
A summary of the key risks, discussed and agreed during the Board’s half-year risk review in February 2019, together with their mitigating actions, are set out below:
External risks
Economic environment and society
Lower economic growth or reduction in economic activity, changing travel patterns.
Mitigating actions
- Continue to focus our operations in more resilient geographical areas
- Local management constantly assesses the needs of local markets and direct services and products accordingly
- Provide attractive services and products
- Focus on driving volumes through innovative and targeted marketing
- Generate customer loyalty through initiatives such as smart ticketing
- Proactive cost control
- Make public transport easier to access and use
- Robust bid modelling considers differing economic scenarios, including the UK’s exit from the European Union
Political and regulatory framework
Changes to the legal and regulatory framework, the implementation of the Bus Services Act 2017, and the impact of the UK leaving the EU.
Mitigating actions
- Limited exposure to local authority funding, as our operations are largely commercial
- Actively participate in key industry, trade and government steering and policy development groups
- Collaboration and partnership working with local authorities
- Devise strategy for bus franchising
- Demonstrate the value delivered by the private sector through investment in services, responding quickly and flexibly to passenger needs
Strategic risks
Sustainability of rail profits or loss of franchise
Failure to retain Southeastern franchise on acceptable terms.
Mitigating actions
- Flexible and experienced management team which responds quickly and expertly to changing circumstances
- Shared risk through the Govia joint venture, which is 65% owned by Go-Ahead and 35% by Keolis
- Invest in performance improvements
- Work constructively with industry partners, such as Network Rail and the Department for Transport, to deliver long term economic and infrastructure benefits
- Significant resource and financial investment in bidding for new franchises
- Regular Board review of rail performance, and Board approval of overall rail bidding strategy
- Compliance with franchise conditions closely monitored
- Reduce head office costs across the Group
- Preparation for German rail contract ahead of its start date in 2019 and further contract win on ‘Augsburger Net’ starting to operate in 2022
Inappropriate strategy or investment
Failure to make appropriate strategic or investment decisions.
Mitigating actions
- Comprehensive strategic discussions with main Board and advisors
- Extensive valuation and due diligence, supported by external expertise
- Maintain strong financial discipline when assessing viability of opportunities
- Cautious approach to investment opportunities overseas and outside our core operating areas
- The Board has a clearly stated risk appetite that governs the acceptable level of risk in pursuit of objectives
Competition
Competition from existing and new market participants, loss of business to other modes of transport and threats from market disruptors.
Mitigating actions
- Disciplined and focused bidding
- Adapt to changing customer requirements and technological advancements
- Foster close relationships with stakeholders to ensure we are meeting requirements including service quality and price
- Work in partnership with local authorities and other operators
- Promote multi-modal travel, improving the overall door-to-door experience for passengers
- Remain at the forefront of promoting and introducing inter-operable ticketing schemes
- Focus on customer needs and expectations, including more channels for ticket purchase and journey planning
Operational risks
Catastrophic incident or severe infrastructure failure
An incident, such as a major accident, an act of terrorism, a pandemic, or a severe failure of rail infrastructure.
Mitigating actions
- Rigorous, high profile health and safety programme throughout the Group
- Promotion of safety culture and first Go-Ahead Safety Conference held in December 2018
- Appropriate and regularly reviewed and tested contingency and disaster recovery plans
- Thorough and regular staff training
- Work closely with our industry partners, such as rail infrastructure provider, Network Rail, and government agencies
- We have maintained high levels of safety performance, demonstrating our continuing efforts to minimise this risk
Large scale infrastructure projects
Large scale infrastructure projects on and around the networks on which we operate, such as the Thameslink Programme, HS2 and major roadworks.
Mitigating actions
- Work constructively with industry partners, such as Network Rail, to minimise the impact of any disruption on our passengers
- Strong engagement with stakeholders, including our customers, to enable effective communication, especially during structural change programmes and disruption to the service
- Good relationships with local authorities and industry bodies, such as the DfT
Labour costs, employee relations and resource planning
Failure to effectively engage with our people and trade unions in making change and managing costs, including pensions.
Mitigating actions
- Work to maintain good relationships with employees and trade unions
- Robust workforce planning with skill requirements identified
- Robust and regularly reviewed recruitment and retention policies, training schemes, resource planning and working practices
- Experienced approach to wage negotiations
- Employee engagement surveys across all businesses to identify issues
- Engaging all our people in the vision, beliefs and attitudes
- Proactive management of pension risks
Information technology failure or interruption or security breach
Prolonged or major failure of the Group’s IT systems or a significant data breach.
Mitigating actions
- Implementation of the Group-wide GDPR project, to ensure compliance
- Appointment of a Group Data Protection Officer
- Robust processes and procedures in place to ensure compliance with the relevant laws and best practices
- Process standardisation and continued investment in best practice systems, including ’light sites’ and ’load bearing’ servers
- Clear and tested business continuity plans
- Proactive approach to cyber security issues
- Cyber Essentials, a government backed cyber security certification scheme, was achieved
- GTR and Southeastern audited against the NIS framework
- Continued investment in and maintenance of IT systems across the Group
- Test scenarios conducted across the Group
- Adoption of Cybersecurity strategy and ISMS framework across the Group, with the publication of monthly KPIs measuring mitigating measures (laptop encryption, USB port lockdown, anti-virus protection etc)
Mobilisation of international rail contracts
Failure to fully mobilise contracts within contractual timescales
Mitigating actions
- Experienced local teams
- Strong governance processes in place with Head Office
- Strong relationships with local authorities
- Compliance with strong local regulation, established Safety Management Systems and Group Audits
Brexit
In light of the uncertainty around the terms of the UK’s departure from the EU, the Group has conducted a risk review process and has put practical mitigation measures in place against identifiable risks including increasing spares of parts and supporting our EU-citizen colleagues that wish to remain in the UK. Southeastern are actively engaged with industry partners to mitigate any impact from congestion and logistical disruption that may arise in Kent.
Critical accounting judgements and key sources of estimation uncertainty
The critical accounting judgements and key sources of estimation uncertainty disclosed on page 134 of the Group Annual Report and Accounts for the year ended 30 June 2018 continue to apply, and in particular the key sources of estimation uncertainty associated with contract and franchise accounting. Contract and franchise accounting is specific to the rail business disclosed in the segmental analysis in note 4. Judgements are made on a continuing basis, with the GTR franchise being the most complex.
As previously announced, an agreement has been reached with the DfT regarding contractual matters in relation to the GTR franchise. This agreement resolves matters relating to the industry-wide failures concerning the introduction of the May timetable, as well as bringing to a close the discussions around other outstanding contractual variations. As part of the agreement, a plan for the remainder of the franchise term to 2021 has been agreed, aimed at building on recent performance improvement and improving customer journeys. GTR will provide £15m of funding this year for passenger enhancements and separately accounted for the impact of any potential fines with the Office of Rail and Road (“ORR”). The agreement reduces uncertainty around the future of the GTR franchise and its financial performance. A profit-sharing mechanism with the DfT will also be introduced for the remainder of the franchise. As a result, the margin over the franchise term is now expected to be between 0.75 to 1 per cent (previously 0.75 to 1.5 per cent), with no profit expected in the current financial year.
4. Segmental analysis
The Group’s businesses are managed on a divisional basis. Selected financial data is presented on this basis below.
For management purposes, the Group is organised into three reportable segments: regional bus, London bus, and rail. Operating segments within those reportable divisions are combined on the basis of their long term characteristics and similar nature of their products and services, as follows:
The regional bus division comprises UK bus operations outside of London.
The London bus division comprises bus operations in London under control of Transport for London (TfL), rail replacement and other contracted services in London, bus operations in Singapore under control of the Land Transport Authority (LTA) of Singapore and bus operations in Ireland under the control of the National Transport Authority (NTA) of Ireland. The Irish operations commenced on 9 September 2018. These are aggregated as a segment given the similar contractual nature of the business.
The rail division comprises UK and overseas rail operations. The UK rail operation through an intermediate holding company, Govia Limited, is 65% owned by Go-Ahead and 35% by Keolis and comprises two rail franchises: Southeastern and GTR. The division is aggregated for the purpose of segmental reporting under IFRS 8 as each operating company has similar objectives, to provide passenger rail services and achieve a modest profit margin through its franchise arrangements with the Department for Transport (DfT). Each company targets similar margins, has similar economic risks and is viewed and reacted to as one segment by the chief operating decision maker, considered to be the Group Chief Executive. The registered office of Keolis (UK) Limited is in England and Wales.
Overseas rail operations are currently being mobilised in Germany and the Nordics and are 100% owned by Go-Ahead. The international rail franchises are included with the UK rail operations for reporting purposes and will be considered in further detail when operational in June 2019 (Germany) and December 2019 (Norway).
The information reported to the Group Chief Executive in his capacity as chief operating decision maker does not include an analysis of assets and liabilities and accordingly IFRS 8 does not require this information to be presented. Segment performance is evaluated based on operating profit or loss excluding amortisation of intangible assets.
Transfer prices between operating segments are on an arm’s length basis similar to transactions with third parties.
The following tables present information regarding the Group’s reportable segments for the six months ended 29 December 2018, the six months ended 30 December 2017 and the year ended 30 June 2018.
Six months ended 29 December 2018 (unaudited)
|
Regional |
London |
Total |
Rail |
Total |
|
|---|---|---|---|---|---|
|
Segment revenue |
231.4 |
288.3 |
519.7 |
1,447.9 |
1,967.6 |
|
Inter-segment revenue |
(14.8) |
(13.3) |
(28.1) |
(18.7) |
(46.8) |
|
Group revenue |
216.6 |
275.0 |
491.6 |
1,429.2 |
1,920.8 |
|
Operating costs |
(193.6) |
(251.1) |
(444.7) |
(1,411.6) |
(1,856.3) |
|
Group operating profit (pre-exceptional items) |
23.0 |
23.9 |
46.9 |
17.6 |
64.5 |
|
Exceptional items |
(16.8) |
||||
|
Group operating profit (post-exceptional items) |
47.7 |
||||
|
Share of result of joint venture |
(0.3) |
||||
|
Net finance costs |
(3.2) |
||||
|
Profit before tax and non-controlling interests |
44.2 |
||||
|
Tax expense |
(9.4) |
||||
|
Profit for the period |
34.8 |
During the six months ended 29 December 2018, segment revenue of £33.2m (H1’18: £24.6m; 2018: £52.1m), from external customers outside the United Kingdom, related to the Singapore and Irish bus operations.
We have two major customers which individually contribute more than 10% of the group revenue, one of which contributes £870.5m (H1’18: £611.8m; 2018: £1,278.5m) and the other contributes £238.1m (H1’18: £244.1m; 2018: £491.8m).
Six months ended 30 December 2017 (unaudited)
|
Regional |
London |
Total |
Rail |
Total |
|
|
Segment revenue |
207.0 |
279.6 |
486.6 |
1,374.8 |
1,861.4 |
|
Inter-segment revenue |
(14.9) |
(7.5) |
(22.4) |
(9.6) |
(32.0) |
|
Group revenue |
192.1 |
272.1 |
464.2 |
1,365.2 |
1,829.4 |
|
Operating costs |
(167.6) |
(250.0) |
(417.6) |
(1,324.9) |
(1,742.5) |
|
Group operating profit |
24.5 |
22.1 |
46.6 |
40.3 |
86.9 |
|
Share of result of joint venture |
(0.3) |
||||
|
Net finance costs |
(6.9) |
||||
|
Profit before tax and non-controlling interests |
79.7 |
||||
|
Tax expense |
(16.1) |
||||
|
Profit for the period |
63.6 |
Year ended 30 June 2018 (audited)
|
Regional |
London |
Total |
Rail |
Total |
|
|
Segment revenue |
418.8 |
571.2 |
990.0 |
2,554.7 |
3,544.7 |
|
Inter-segment revenue |
(35.1) |
(20.7) |
(55.8) |
(27.4) |
(83.2) |
|
Group revenue |
383.7 |
550.5 |
934.2 |
2,527.3 |
3,461.5 |
|
Operating costs |
(337.9) |
(504.9) |
(842.8) |
(2,482.8) |
(3,325.6) |
|
Group operating profit (pre-exceptional items) |
45.8 |
45.6 |
91.4 |
44.5 |
135.9 |
|
Exceptional items |
25.1 |
||||
|
Group operating profit (post-exceptional items) |
161.0 |
||||
|
Share of result of joint venture |
(1.1) |
||||
|
Net finance costs |
(14.2) |
||||
|
Profit before tax and non-controlling interests |
145.7 |
||||
|
Tax expense |
(36.4) |
||||
|
Profit for the year |
109.3 |
During the six months to 29 December 2018 the Group incurred capital expenditure of £42.0m (H1’18: £56.8m; 2018: £126.7m) on tangible fixed assets of which £26.3m (H1’18: £27.0m; 2018: £47.9m) related to the regional bus division, £4.8m (H1’18: £12.3m; 2018: £51.7) related to the London bus division and £10.9m (H1’18: £17.5m; 2018: £27.1m) related to the rail division.
During the six months to 29 December 2018 the depreciation charge for the Group was £39.4m (H1’18: £44.3m; 2018: £82.7m) of which £18.0m (H1’18: £16.7m; 2018: £34.1m) related to the regional bus division, £13.6m (H1’18: £12.4m; 2018: £27.7m) related to the London bus division and £7.8m (H1’18: £15.2m; 2018: £20.9m) related to the rail division.
5. Exceptional operating items
This note identifies items of an exceptional nature that have a significant impact on the results of the Group in the period.
|
Six months to |
Six months to |
Year to |
|
|
Charge in relation to GMP equalisation |
(16.8) |
– |
– |
|
Gain on change in RPI/CPI assumptions |
– |
– |
35.2 |
|
Goodwill and asset impairment |
– |
– |
(10.1) |
|
Exceptional items |
(16.8) |
– |
25.1 |
Six months ended 29 December 2018 (unaudited)
Total exceptional operating items in the year were a charge of £16.8m to the income statement.
On 26 October 2018 the High Court ruled that Guaranteed Minimum Pensions (“GMP”) should be equalised between men and women.
As a result, pension scheme trustees will be obliged to adjust benefit payments in order that benefits received by male and female members with equivalent age, service and earnings histories are equal. The judgement has implications for many defined benefit schemes, including those in which the Go-Ahead Group participates.
We have worked with our actuarial advisors to understand the implications of the judgement and the £16.8m pre-tax exceptional expense in the period (H1’18: £nil) reflects our best estimate of the effect on our reported pension liabilities.
Year ended 30 June 2018
Total exceptional operating items in the year were a gain of £25.1m.
During the year ended 30 June 2018 the Go-Ahead Group Pension Plan (the Go-Ahead Plan) changed the reference inflation index used to estimate the annual increases to the pensions payable. From 1 April 2018, the Consumer Prices Index (CPI) is used to increase pensions in payment rather than the Retail Prices Index (RPI). The change reduces the financial risks of the Plan and enhances the long term sustainability of the scheme, providing an improvement in the security of Plan members’ benefits. A one-off gain of £35.2m was recognised in respect of this change in line with IAS 19 and the Group’s accounting policies.
During the year, goodwill of £8.4m was impaired relating to Konectbus, Thames Travel and Carousel bus operations, following a period of underperformance in all three individual cash-generating units. The carrying value of the goodwill in Konectbus, Thames Travel and Carousel is now £nil. Assets with a carrying value of £2.4m were also deemed to be impaired within the Go East Anglia and Oxford bus operations.
During the year, negative goodwill of £0.7m arose on the business combinations in the year.
The tax impact of the above exceptional items plus accrued amounts relating to an ongoing HMRC capital allowances enquiry is £11.5m (2017: £nil). In addition, an accrued amount of £2.6m was provided for within finance costs in relation to the interest payable of this enquiry.
Six months ended 30 December 2017 (unaudited)
There were no exceptional items in the period ended 30 December 2017.
6. Taxation
a. Tax recognised in the income statement
The total taxation charge recognised in the income statement is made up as follows:
|
Six months to |
Six months to |
Year to |
|
|---|---|---|---|
|
Current tax charge |
12.3 |
16.1 |
23.9 |
|
Adjustments in respect of current tax of previous years |
– |
– |
13.3 |
|
Total current tax |
12.3 |
16.1 |
37.2 |
|
Deferred tax relating to origination and reversal of temporary differences in the period at 19% |
(2.9) |
– |
6.6 |
|
Adjustments in respect of deferred tax of a prior period |
– |
– |
(7.4) |
|
Total deferred tax |
(2.9) |
– |
(0.8) |
|
Tax reported in the consolidated income statement |
9.4 |
16.1 |
36.4 |
The taxation charge has been calculated by applying the directors’ best estimate of the annual effective tax rate to the profit for the period. The effective tax rate is 21.3% (H1’18: 20.2%; 2018: 25.0%), higher than the statutory rate. The interim tax rate is based on the full year expected tax rate.
The tax reported in the consolidated income statement includes:
Six months ended 29 December 2018 (unaudited)
The tax reported in consolidated income statement includes exceptional amounts of £2.9m arising on the estimated change in the bus pension scheme liabilities as a result of the GMP equalisation ruling which occurred during the period.
Year ended 30 June 2018
The tax reported in consolidated income statement includes exceptional amounts arising on the change in RPI/CPI assumptions on The Go-Ahead Group Pension Plan (the Go-Ahead Plan) and amounts in relation to an HMRC enquiry on capital planning. The HMRC enquiry was fully settled in January 2019.
Six months ended 30 December 2017 (unaudited)
There were no exceptional taxation items in the period ended 30 December 2017.
b. Tax recognised in equity
The tax relating to items charged or credited to the statement of comprehensive income or directly to equity is made up as follows:
|
Six months to |
Six months to |
Year to |
|
|---|---|---|---|
|
Tax on remeasurements on defined benefit pension plans |
(4.3) |
3.4 |
3.3 |
|
Deferred tax on cashflow hedges |
(3.3) |
3.1 |
5.2 |
|
Deferred tax on share based payments (taken directly to equity) |
– |
– |
0.5 |
|
Tax reported outside of profit or loss |
(7.6) |
6.5 |
9.0 |
c. Factors affecting future tax charges
The standard rate of UK corporation tax is currently 19%. A rate reduction to 17% comes into effect from 1 April 2020. This reduction in rate was substantively enacted prior to the balance sheet date and has been applied to the Group’s deferred tax balance at the balance sheet date.
7. Earnings per share
Basic and diluted earnings per share
|
Six months to 29 Dec 18 |
Six months to 30 Dec 17 |
Year to 30 Jun 18 |
|||||
|---|---|---|---|---|---|---|---|
|
Pre- exceptional |
Exceptional items |
Post- exceptional |
|
Pre- exceptional |
Exceptional |
Post- exceptional |
|
|
Net profit on total operations attributable to equity holders of the parent (£m) |
40.0 |
(13.9) |
26.1 |
49.6 |
78.0 |
11.0 |
89.0 |
|
Basic weighted average shares in issue (‘000) |
42,974 |
– |
42,974 |
42,938 |
42,958 |
– |
42,958 |
|
Dilutive potential share options (‘000) |
89 |
– |
89 |
73 |
101 |
– |
101 |
|
Diluted weighted average number of shares in issue (‘000) |
43,063 |
– |
43,063 |
43,011 |
43,059 |
– |
43,059 |
|
Earnings per share: |
|||||||
|
Basic earnings per share (pence per share) |
93.2 |
(32.5) |
60.7 |
115.5 |
181.6 |
25.6 |
207.2 |
|
Diluted earnings per share (pence per share) |
93.0 |
(32.4) |
60.6 |
115.3 |
181.2 |
25.5 |
206.7 |
The weighted average number of shares in issue excludes treasury shares held by the Company, and shares held in trust for the
Long Term Incentive Plan (for executive directors only) and the Deferred Share Bonus Plan (for executive directors and certain other
senior employees).
No shares were bought back and cancelled by the Group in the period from 29 December 2018 to 20 February 2019.
8. Pensions
Retirement benefit obligations consist of the following:
|
Bus |
Rail |
29 Dec 18 |
Bus |
Rail |
30 Jun 18 |
|
|
Pre-tax pension scheme (liability)/asset |
(1.2) |
– |
(1.2) |
36.8 |
– |
36.8 |
|
Deferred tax asset/(liability) |
0.2 |
– |
0.2 |
(6.5) |
– |
(6.5) |
|
Post-tax pension scheme (liability)/asset |
(1.0) |
– |
(1.0) |
30.3 |
– |
30.3 |
The net deficit before taxation on the bus defined benefit scheme was £1.2m (30 June 2018: surplus of £36.8m), consisting of estimated liabilities of £817.7m (30 June 2018: £792.5m) less assets of £816.5m (30 June 2018: £829.3m). During the period, an exceptional charge of £16.8m has been taken to the Income Statement as a result of the GMP equalisation ruling which directly impacted the bus pension scheme liabilities.
The net deficit before taxation on the rail schemes was £nil (30 June 2018: £nil). The nature of these schemes means at the end of the franchise, any deficit or surplus in the scheme passes to the subsequent franchisee with no compensating payments from or to the outgoing franchise holder. The Group’s obligations are therefore limited to its contributions payable to the schemes during the period over which it operates the franchise.
The net surplus/deficit on the pension schemes was calculated based on the following assumptions.
|
Six months to |
Year to |
|
|---|---|---|
|
Retail price index inflation |
3.3 |
3.1 |
|
Consumer price index inflation |
2.3 |
2.1 |
|
Discount rate |
2.8 |
2.7 |
|
Rate of increase in salaries * |
3.6 |
3.4 |
|
Rate of increase of pensions in payment and deferred pension |
2.0 |
1.8 |
* for rail pension schemes only (the defined benefit section of the bus scheme is closed to future accrual for all members)
The most significant non-financial assumption is the assumed rate of longevity. The table below shows the life expectancy assumptions used in the accounting assessments based on the life expectancy of a male member of each pension scheme at age 65.
|
Bus |
29 Dec 18 |
Bus |
30 Jun 18 |
|
|---|---|---|---|---|
|
Pensioner |
21 |
21 |
21 |
21 |
|
Non Pensioner |
22 |
24 |
22 |
23 |
Sensitivity analysis
The following is an approximate sensitivity analysis of the impact of the change in the key assumptions for the bus scheme calculated as at 30 June 2018. In isolation the following adjustments would adjust the pension (deficit)/surplus as shown.
|
Bus |
|
|---|---|
|
Discount factor – increase of 0.1% |
(1.7) |
|
Price inflation – increase of 0.1% |
1.5 |
|
Rate of increase of pension in payment – increase of 0.1% |
0.9 |
|
Increase in life expectancy of pensioners or non-pensioners by 1 year |
3.6 |
9. Notes to the cashflow statement
Analysis of Group net cash/(debt) (unaudited)
|
Cash and cash equivalents |
Syndicated loan facility |
Hire purchase/ |
£250m |
Euro financing |
Total |
|
|---|---|---|---|---|---|---|
|
30 June 2018 |
556.5 |
(136.0) |
(9.4) |
(250.0) |
(11.2) |
149.9 |
|
Cashflow |
39.0 |
13.2 |
1.8 |
– |
(4.0) |
50.0 |
|
29 December 2018 |
595.5 |
(122.8) |
(7.6) |
(250.0) |
(15.2) |
199.9 |
Cash and cash equivalents include overdrafts amounting to £nil (30 June 2018: £nil).
On 16 July 2014, the Group entered into a £280.0m five year syndicated loan facility. The loan facility is unsecured and interest is charged at LIBOR + Margin, where the margin is dependent upon the gearing of the Group. The facility had an initial maturity of July 2019, with two one-year extensions, the second of which was agreed on 20 June 2016, extending the maturity of the facility to July 2021 from that date.
On 20 July 2018, an additional extension of two years was agreed, extending the maturity of the facility to July 2023. Two further one-year extensions are available which, if exercised, would extend the maturity to July 2025.
On 6 July 2017, the Group raised a £250.0m bond of 7 years maturing on 6 July 2024 with a coupon rate of 2.5%.
On 27 April 2017, the Group’s subsidiary, Go-Ahead Verkehrsgesellschaft Deutschland GmbH, entered into a €20.0m one year revolving credit facility. On 24 October 2017, €12.0 m of this facility was replaced with a €10.6m 10.5 year loan facility with the Group’s subsidiary, Go-Ahead Facility GmbH.
Group net cash/(debt) excludes unamortised issue costs of £3.5m (30 June 2018: £3.4m).
As at 29 December 2018 balances amounting to £461.6m (H1’18: £418.8m; 30 June 2018: £438.9m) were restricted, including amounts to cover deferred income for season tickets sold in advance of £207.0m (H1’18: £204.5m; 30 June 2018: £162.8m) and amounts held by rail companies which can only be distributed up to the value of distributable reserves, subject to DfT dispensation.
10. Dividends paid and proposed
|
Six months to |
Six months to |
Year to |
|
|---|---|---|---|
|
Declared and paid during the period |
|||
|
Equity dividends on ordinary shares: |
|||
|
Final dividend for 2018: 71.91p per share (2017: 71.91p) |
30.9 |
30.9 |
30.9 |
|
Interim dividend for 2018: 30.17p per share |
– |
– |
12.9 |
|
30.9 |
30.9 |
43.8 |
|
Six months to |
Six months to |
Year to |
|
|---|---|---|---|
|
Dividend proposed (not recognised as a liability) |
|||
|
Equity dividends on ordinary shares: |
|||
|
Interim dividend for 2019: 30.17p per share (2018: 30.17p) |
12.9 |
12.9 |
31.0 |
11. Assets classified as held for sale
At 29 December 2018, assets held for sale, with a carrying value of £0.6m related to property, plant and equipment available for sale and are included in the regional bus division (30 June 2018: £13.1m with £1.7m included in the regional bus segment and £11.4m included in London bus segment).
12. Derivatives and financial instruments
a. Fair values
The fair values of the Group’s financial derivatives carried in the financial statements have been reviewed as at 29 December 2018 and
30 June 2018 and are as follows:
|
29 Dec 18 |
30 Jun 18 |
|
|---|---|---|
|
Non-current assets |
1.6 |
8.1 |
|
Current assets |
1.0 |
10.0 |
|
2.6 |
18.1 |
|
|
Current liabilities |
(1.3) |
– |
|
Non-current liabilities |
(1.4) |
– |
|
(2.7) |
– |
|
|
Net financial derivatives |
(0.1) |
18.1 |
At 29 December 2018
|
Amortised cost |
Held for trading – Fair value through profit and loss |
Total |
Fair value |
|
|
Fuel price derivatives |
– |
(0.1) |
(0.1) |
(0.1) |
|
Net financial derivatives |
– |
(0.1) |
(0.1) |
(0.1) |
|
Obligations under finance lease and hire purchase contracts |
(7.6) |
– |
(7.6) |
(7.6) |
|
(7.6) |
(0.1) |
(7.7) |
(7.7) |
At 30 June 2018
|
Amortised cost |
Held for trading – Fair value through profit and loss |
Total |
Fair value |
|
|---|---|---|---|---|
|
Fuel price derivatives |
– |
18.1 |
18.1 |
18.1 |
|
Net financial derivatives |
– |
18.1 |
18.1 |
18.1 |
|
Obligations under finance lease and hire purchase contracts |
(9.4) |
– |
(9.4) |
(9.4) |
|
(9.4) |
18.1 |
8.7 |
8.7 |
The fair value of all other financial assets and liabilities is not significantly different from their carrying amount, with the exception of the £250.0m sterling 7 year bond which has a fair value of £240.8m (30 June 2018: £245.4m) but is carried at its amortised cost of £250.0m (30 June 2018: £250.0m). The fair value of the £250.0m sterling 7 year bond has been determined by reference to the price available from the market on which the bond is traded. The fuel price derivatives were valued externally by the respective banks by comparison with the market fuel price for the relevant date.
All other fair values shown above have been calculated by discounting cash flows at prevailing interest rates.
The Group uses the following hierarchy for determining and disclosing the fair value of financial instruments by valuation technique:
Level 1: quoted (unadjusted) prices in active markets for identical assets or liabilities;
Level 2: other techniques for which the lowest level input that is significant to the fair value measurement is directly or indirectly observable; and
Level 3: techniques for which the lowest level input that is significant to the fair value measurement is unobservable.
As at 29 December 2018, the Group has used a level 2 valuation technique to determine the fair value of all financial instruments. During the six months ended 29 December 2018, there were no transfers between valuation levels.
b. Hedging activities
Fuel derivatives
The Group is exposed to commodity price risk as a result of fuel usage. The Group closely monitors fuel prices and uses fuel derivatives to hedge its exposure to increases in fuel prices, when it deems this to be appropriate.
Bus
As at 29 December 2018 the Group had derivatives against UK bus fuel of 192 million litres for the three years ending June 2022. The fair value of the asset or liability has been recognised on the balance sheet. The value has been generated since the date of acquisition of the instruments due to the movement in market fuel prices.
As at 29 December 2018 the amounts externally hedged are as follows:
|
2019 |
2020* |
2021* |
2022* |
|
|---|---|---|---|---|
|
Actual percentage of forecast usage externally hedged |
100% |
75% |
50% |
20% |
|
Litres hedged (million) |
49 |
77 |
48 |
18 |
|
Price (pence per litre) |
33.2 |
35.3 |
36.3 |
39.0 |
* Assuming consistent usage and that hedging is completed at 29 December 2018 market price
The movement during the six months ended 29 December 2018 on the hedging reserve was £14.8m debit (net of tax) (2018: £23.0m credit (net of tax)) taken through other comprehensive income.
13. Provisions
|
|
Franchise |
Uninsured claims |
Other |
Total |
|
|---|---|---|---|---|---|
|
At 30 June 2018 |
51.9 |
45.3 |
6.1 |
103.3 |
|
|
Provided |
18.6 |
5.7 |
0.8 |
25.1 |
|
|
Utilised |
(2.0) |
(3.5) |
– |
(5.5) |
|
|
Released |
(0.9) |
(2.5) |
– |
(3.4) |
|
|
Unwinding of discount |
– |
0.2 |
– |
0.2 |
|
|
At 29 December 2018 |
67.6 |
45.2 |
6.9 |
119.7 |
|
29 Dec 18 |
30 Jun 18 |
|
|---|---|---|
|
Current |
35.9 |
29.6 |
|
Non-current |
83.8 |
73.7 |
|
119.7 |
103.3 |
Franchise commitments comprise £62.6m (30 June 2018: £51.5m) dilapidation provisions on vehicles, depots and stations mainly across our two active rail franchises and £5.0m (30 June 2018: £0.4m) provisions relating to other franchise commitments. Of the dilapidations provisions, £13.5m (30 June 2018: £15.1m) are classified as current. All of the £5.0m (30 June 2018: £0.4m) other provision relating to other franchise commitments is classified as current. During the six months ended 29 December 2018, £0.9m of provisions previously provided were released following the successful renegotiation of certain contract conditions. The dilapidations will be incurred as part of a rolling maintenance contract over the remaining life of the franchises. The provisions are based on management’s assessment of most probable outcomes, supported where appropriate by valuations from professional external advisors.
Uninsured claims represent the cost to the Group to settle claims for incidents occurring prior to the balance sheet date, together with an estimate of settlements that will be made in respect of incidents that have not yet been reported to the Group by the insurer. Of the uninsured claims, £16.8m (30 June 2018: £13.4m) are classified as current and £28.5m (30 June 2018: £31.9m) are classified as non-current based on past experience of uninsured claims paid out annually. It is estimated that the majority of uninsured claims will be settled within the next six years.
Within other provisions, £6.6m (30 June 2018: £6.1m) relates to dilapidation provisions on vehicles and depots, of which £0.6m (30 June 2018: £0.7m) are classified as current, and £6.0m (30 June 2018: £5.4m) are classified as non-current. These provisions relate to the bus division. It is expected that the dilapidations will be incurred within two to five years. The remaining £0.3m is other provisions and are classified as non-current.
14. Commitments and contingencies
Capital commitments
Capital commitments contracted but not provided at 29 December 2018 were £26.7m (30 June 2018: £34.8m).
Performance bonds
The Group has provided bank guaranteed performance bonds of £67.1m (30 June 2018: £76.9m), a loan guarantee bond of £36.3m (30 June 2018: £36.3m) and season ticket bonds of £197.3m (30 June 2018: £154.1m) in favour of the DfT in support of the Group’s rail franchise operations. In addition, the Group, together with Keolis, has a joint parental company commitment to provide funds of £136.0m (30 June 2018: £136.0m) to the DfT in respect of the Govia Thameslink Railway franchise, of which Group has a 65% share equating to £88.4m (30 June 2018: £88.4m). At the period end £nil (30 June 2018: £nil) has been provided.
To support subsidiary companies in their normal course of business, the Group has indemnified certain banks and insurance companies who have issued certain performance bonds and a letter of credit. The letter of credit at 29 December 2018 is £58.0m (30 June 2018: £58.0m).
The Group has a bond of $4.2m SGD (30 June 2018: $4.2m SGD) in favour of the Land Transport Authority of Singapore in support of the Group’s Singapore bus operations. At the period end exchange rate this equates to £2.4m (30 June 2018: £2.4m).
The Group has bonds of €5.0m (30 June 2018: €5.0m) in favour of the Ministry of Transport of BW, €1.1m (30 June 2018: €1.1m) in favour of the Ministry of Transport of BW and Bavarian Rail Authority and €5.0m in favour of Bavarian Rail Authority in. All are in support of the Group’s German rail operations, currently being mobilised. At the period end exchange rate these bonds equate to £10.0m (30 June 2018: £5.4m).
The Group has provided a parental company guarantee to provide funds of €35.0m (30 June 2018: €35.0m) in respect of the Germany operations, of which €35.0 (30 June 2018: €nil) has been provided for at year end.
The Group has bonds of €10.0m (30 June 2018: €8.0m) in favour of the National Transport Authority in Ireland in support of the Group’s Irish bus operations. At the period end exchange rate this equates to £9.0m (30 June 2018: £7.1m).
The Group has a bond of 200.0m NOK (30 June 2018: nil) in favour of Jernbanedirectoratet in Norway in support of the Group’s Nordic rail operations. At the period end exchange rate this equates to £18.6m (30 June 2018: £nil).
15. Statement of changes in equity
The reserve for own shares is in respect of 4,049,053 (30 June 2018: 4,060,479) ordinary shares (8.6% of share capital), of which 146,823 (30 June 2018: 158,249) are held for LTIP and DSBP arrangements. The remaining shares were purchased in order to enhance shareholders’ returns and are being held as treasury shares for future issue in appropriate circumstances.
During the six months ended 29 December 2018 the company has repurchased 39,498 shares (year ended 30 June 2018: 64,012). No shares were cancelled in the period (year ended 30 June 2018: no shares cancelled).
16. Related party transactions
There are no related party transactions or changes since the last year end that could have a material effect on the Group’s financial position or performance for the period.
17. Business combinations
Six months ended 29 December 2018
No business combinations have been made in the period.
Year ended 30 June 2018
As disclosed in the 2018 Annual Report, The City of Oxford Motor Services Limited, a wholly owned subsidiary of the Group, acquired 100% of the Share Capital of Tom Tappin Limited on 7 December 2017. Go-North East Limited, a wholly owned subsidiary of the Group, also acquired 100% of the Share Capital of the East Yorkshire Motor Services Group Limited and its subsidiaries. The total consideration paid for business combinations was £9.2m and no significant changes to the fair values previously reported were subsequently identified. Given the size and prior year disclosures further detail is not replicated in this interim report.
18. Post balance sheet event
On 18 February 2019, terms were agreed with FirstGroup to purchase a bus depot located in Manchester in the United Kingdon. The sale is expected to complete by the year-end for cash consideration of £11.2m. The acquisition will include 163 buses and will operate as Go North West.
Responsibility statements
We confirm that to the best of our knowledge:
- the interim financial statements, which have been prepared in accordance with IAS34 ‘Interim Financial Reporting’, give a true and fair view of the assets, liabilities, financial position and profit or loss of The Go-Ahead Group plc as required by the Financial Conduct Authority’s Disclosure and Transparency Rules (‘DTR’) 4.2.4R;
- the interim management report includes a fair review of the information required by DTR 4.2.7R (indication of important events during the first six months and description of principal risks and uncertainties for the remaining six months of the year); and
- the interim management report includes a fair review of the information required by DTR 4.2.8R (disclosure of related party transactions and changes therein).
The Directors of The Go-Ahead Group plc are listed in the Group Annual Report and Accounts for the year ended 30 June 2018.
Since publication, Elodie Brian has replaced Patrick Butcher as Interim Group Chief Financial Officer on 3 December 2018.
A list of current Directors is maintained on Go-Ahead’s website: www.go-ahead.com.
By order of the Board
David Brown
Group Chief Executive
20 February 2019
Cautionary statement
This report is addressed to shareholders of The Go-Ahead Group plc and has been prepared solely to provide information to them.
This half yearly report is intended to inform the shareholders of the Group’s performance during the six months to 29 December 2018 and this report and the announcement under which it was released do not constitute an invitation to underwrite, subscribe for, or otherwise acquire or dispose of any Go-Ahead Group shares or other securities. This report contains forward looking statements based on knowledge and information available to the Directors at the date the report was prepared. These statements should be treated with caution due to the inherent uncertainties underlying any such forward looking information and any statements about the future outlook may be influenced by factors that could cause actual outcomes and results to be materially different.
www.go-ahead.com
Secretary and Registered Office
Carolyn Ferguson
The Go-Ahead Group plc
3rd Floor, 41-51 Grey Street
Newcastle upon Tyne
NE1 6EE
Tel: 0191 232 3123
Head Office
The Go-Ahead Group plc
4 Matthew Parker Street
London
SW1H 9NP
Tel: 020 7799 8999
Joint Corporate Broker
Investec Bank plc
30 Gresham Street
London
EC2V 7QP
Joint Corporate Broker
Jefferies Hoare Govett Ltd
Vintners Place
68 Upper Thames Street
London
EC4V 3BJ
Financial PR Advisors
Citigate Dewe Rogerson
3 London Wall Buildings
London
EC2M 5SY
Registrar
Equiniti Ltd
Aspect House
Spencer Road
Lancing
West Sussex
BN99 6DA
Tel: 0371 384 2193*
*Lines are open 8.30am to 5.30pm Monday to Friday (excluding public holidays in England and Wales)
Auditor
Deloitte LLP
1 New Street Square
London
EC4A 3HQ
Principal banker
The Royal Bank of Scotland plc
Corporate Banking
9th Floor
280 Bishopsgate
London
EC2M 4RB
We have been engaged by the company to review the condensed set of financial statements in the half-yearly financial report for the six months ended 29 December 2018 which comprises the interim consolidated income statement, the interim consolidated statement of comprehensive income, the interim consolidated statement of changes in equity, the interim consolidated balance sheet, the interim consolidated cash flow statement and related notes 1 to 18. We have read the other information contained in the half-yearly financial report and considered whether it contains any apparent misstatements or material inconsistencies with the information in the condensed set of financial statements.
This report is made solely to the company in accordance with International Standard on Review Engagements (UK and Ireland) 2410 “Review of Interim Financial Information Performed by the Independent Auditor of the Entity” issued by the Financial Reporting Council. Our work has been undertaken so that we might state to the company those matters we are required to state to it in an independent review report and for no other purpose. To the fullest extent permitted by law, we do not accept or assume responsibility to anyone other than the company, for our review work, for this report, or for the conclusions we have formed.
Directors’ responsibilities
The half-yearly financial report is the responsibility of, and has been approved by, the directors. The directors are responsible for preparing the half-yearly financial report in accordance with the Disclosure Guidance and Transparency Rules of the United Kingdom’s Financial Conduct Authority.
As disclosed in note 2, the annual financial statements of the group are prepared in accordance with IFRSs as adopted by the European Union. The condensed set of financial statements included in this half-yearly financial report has been prepared in accordance with International Accounting Standard 34 “Interim Financial Reporting” as adopted by the European Union.
Our responsibility
Our responsibility is to express to the Company a conclusion on the condensed set of financial statements in the half yearly financial report based on our review.
Scope of review
We conducted our review in accordance with International Standard on Review Engagements (UK and Ireland) 2410 “Review of Interim Financial Information Performed by the Independent Auditor of the Entity” issued by the Financial Reporting Council for use in the United Kingdom. A review of interim financial information consists of making inquiries, primarily of persons responsible for financial and accounting matters, and applying analytical and other review procedures. A review is substantially less in scope than an audit conducted in accordance with International Standards on Auditing (UK) and consequently does not enable us to obtain assurance
that we would become aware of all significant matters that might be identified in an audit. Accordingly, we do not express
an audit opinion.
Conclusion
Based on our review, nothing has come to our attention that causes us to believe that the condensed set of financial statements in the half-yearly financial report for the six months ended 29 December 2018 is not prepared, in all material respects, in accordance with International Accounting Standard 34 as adopted by the European Union and the Disclosure Guidance and Transparency Rules of the United Kingdom’s Financial Conduct Authority.
Deloitte LLP
Statutory Auditor
London
United Kingdom